The last post on how long it takes to include (not even use) and compile the standard C/C++ headers left a whole lot of people like:

There were questions like “What about using an SSD?” “What about the file cache?” “What about [insert totally appropriate thing interfering with the compilation process here.]” Yep. All valid. And no, I didn’t test (or even acknowledge) any of them.
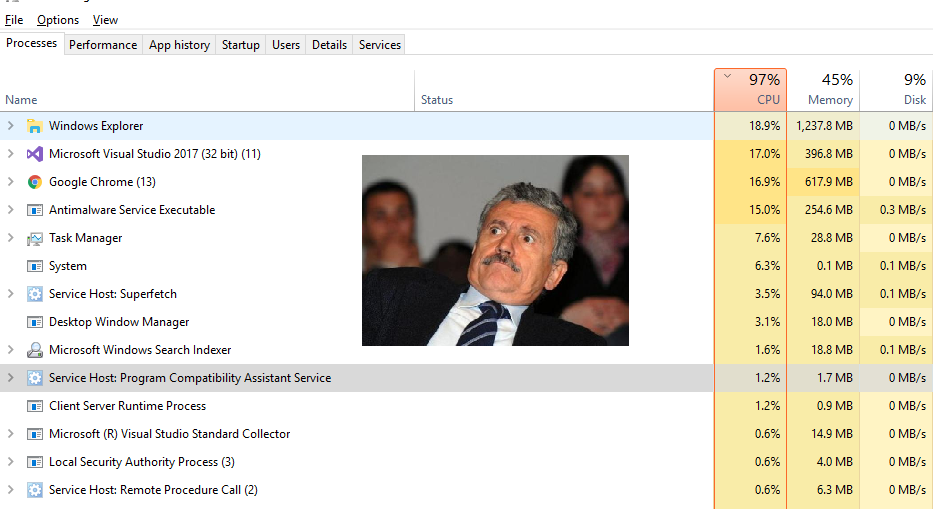
The fact is, it’s easy to blame “bad” programming practices or choices, compilers, slow computers, or possibly even phases of the moon, but there’s always more to it than “one easy trick” will solve. The easiest way to figure out what’s The Biggest Problem isn’t, in this case, to immediately load up your favorite profiler or do some crazy scientist test like I did. Just look at the top running processes and their CPU time. Kill off the easy wins and then narrow down on what, exactly, is causing issues after that. So that’s where we’re starting; with Task Manager!

Ok, obviously there’s a lot more going on here than just compiling some mostly empty files. Let’s fix some of the easy wins first. (note that this part is very unscientific and we’re working purely under the general theory that “fewer other things hogging cpu time is good.”)
Windows Explorer?! Windows Explorer isn’t just the file and directory management tool, it’s also the shell. If you kill the process in Task Manager, the desktop, start menu, and pretty much everything else just goes away (go ahead, try it. It’s ok, you can launch it again as explorer.exe.) So, it looks like there’s two culprits here. First, the test application I wrote is a console application which is spewing text on progress. Second, even though it’s minimized, I have an open file manager window that is on the folder that all of the source files are being built from and into. Closing the file manager window is easy (and has meh results) so I modified the test harness to run without a window. Terrible for progress reports, but good for CPU usage!
Visual Studio?! Yeah, I probably shouldn’t run my test with the debugger attached… Closed!
Chrome?! If I kill the test, Chrome goes down to ~1.3% usage. As soon as I start it up (and even if I leave it up) it’s usage spikes again. No idea, and not worth spending time investigating at this stage. Close that sucker down!
Antimalware Service Executable is part of Windows Defender, not some strange beast that is part ant and part animal. Like any antivirus, it’s going to wreak havoc on your compilation times. You’ll want to disable it from scanning the folders where your compiler source (libs, includes, etc.) is located as well as your own source code.
For Windows Defender, hit the Windows key, type “Windows Defender Settings” and hit enter. Under “Virus & thread protection”, go to “Virus & thread protection settings” and scroll down to “Exclusions.” Click “Add or remove exclusions” and add the necessary folders. I used procmon to find the offending files and folders and, after futzing with it for about 30 minutes, ended up just disabling it temporarily. Done.
The end result was that I got about a 10% boost across the board in compilation time. Being that it took longer to write the blog post than it did to make the actual changes (about 45 minutes, most of which was futzing with Windows Defender) I’ll take that as a solid win… for now.
Heya! I just wanted to ask if you ever have any issues with hackers?
My last blog (wordpress) was hacked and I ended up losing several weeks of hard work
due to no data backup. Do you have any solutions to protect against hackers?